Bias and Fairness COMP90073 Trustworthy Machine Learning Hanxun Huang, CIS Semester 2, 2026 · Lecture 22
Lecture map Outline
01 Where does unfair ML cause real harm?
02 How do we measure fairness?
03 Where does bias come from, and how do we reduce it?
Bias and fairness · what is bias? What is bias in machine learning?
A biased model works worse, or decides worse, for some groups of people.
Some groups get worse results. More errors, fewer opportunities, or harmful outputs for some groups. It is often not intentional. Bias appears even when everyone involved has good intentions. It is not one-and-done. A model that is fair today can become unfair later. It is not new. Researchers have raised these concerns for more than 50 years. Mehrabi, N., Morstatter, F., Saxena, N., Lerman, K., & Galstyan, A. (2021). A survey on bias and fairness in machine learning. ACM Computing Surveys, 54 (6), 1–35. https://doi.org/10.1145/3457607
Real-world harm · criminal justice
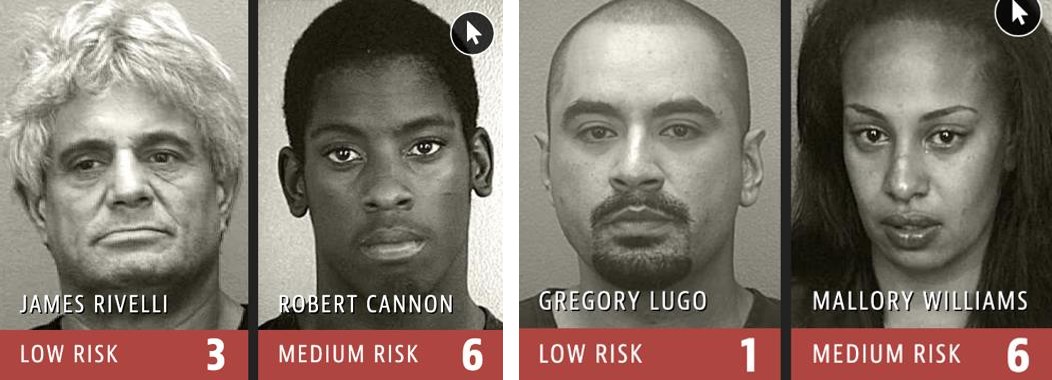
COMPAS: bias in a criminal risk tool
COMPAS, a risk assessment tool for criminals used by the US government, has shown a harmful bias against African-Americans.
A risk score for defendants It predicts who will reoffend, on a scale of 1 to 10.Harmful bias against African-Americans Of people who did not reoffend, labelled high risk: Black 44.9%, white 23.5%.Angwin, J., Larson, J., Mattu, S., & Kirchner, L. (2016, May 23). Machine bias. ProPublica . Chouldechova, A. (2017). Fair prediction with disparate impact: A study of bias in recidivism prediction instruments. Big Data, 5 (2), 153–163. https://doi.org/10.1089/big.2016.0047
Real-world harm · recommenders
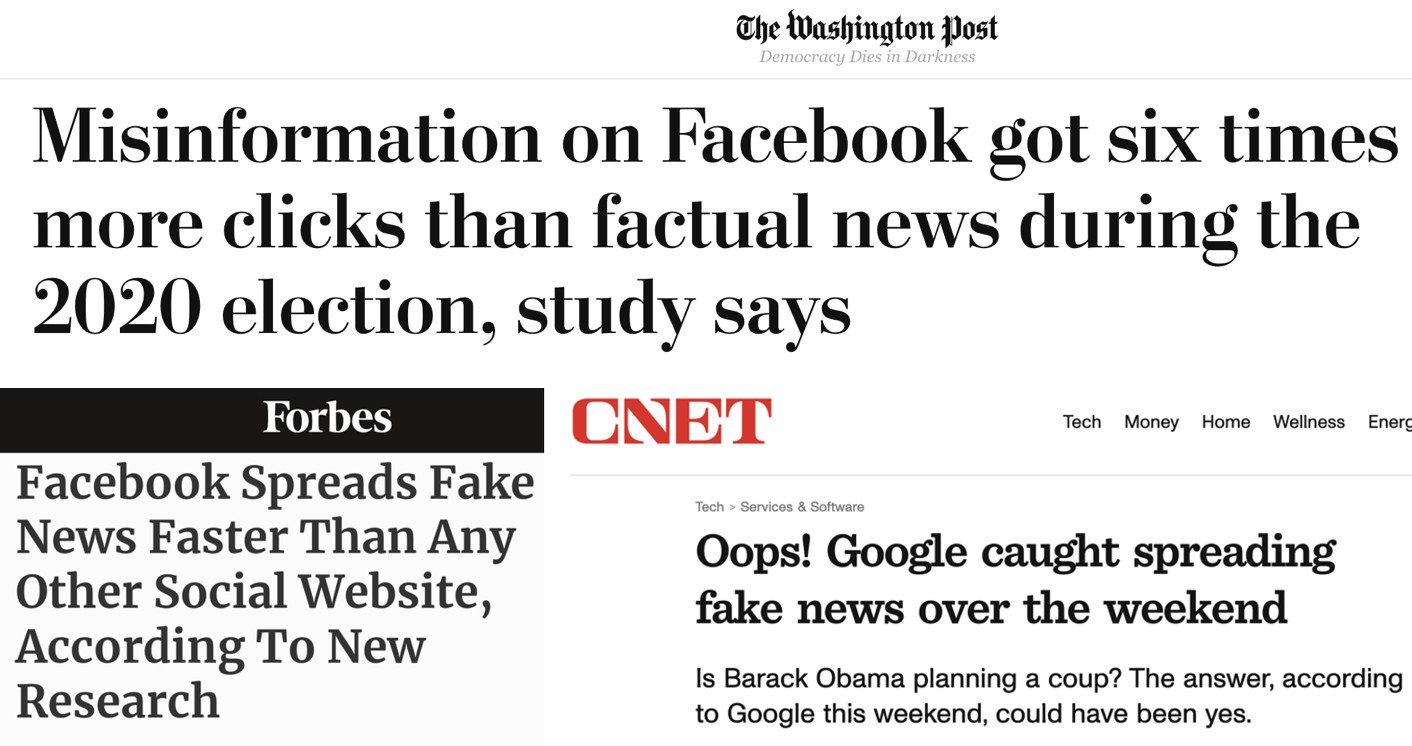
Spread of false information and radicalisation
Search engines and social recommendation systems optimise for user engagement and how long users stay.
Optimise for engagement The ranker shows what gets clicks and keeps you on the site longer.False news gets more clicks One study: misinformation got six times more clicks on Facebook.Social bubbles form Click a few posts on one view, and your feed fills with that view.Mehrabi, N., Morstatter, F., Saxena, N., Lerman, K., & Galstyan, A. (2021). A survey on bias and fairness in machine learning. ACM Computing Surveys, 54 (6), 1–35. https://doi.org/10.1145/3457607
Real-world harm · pre-trained models
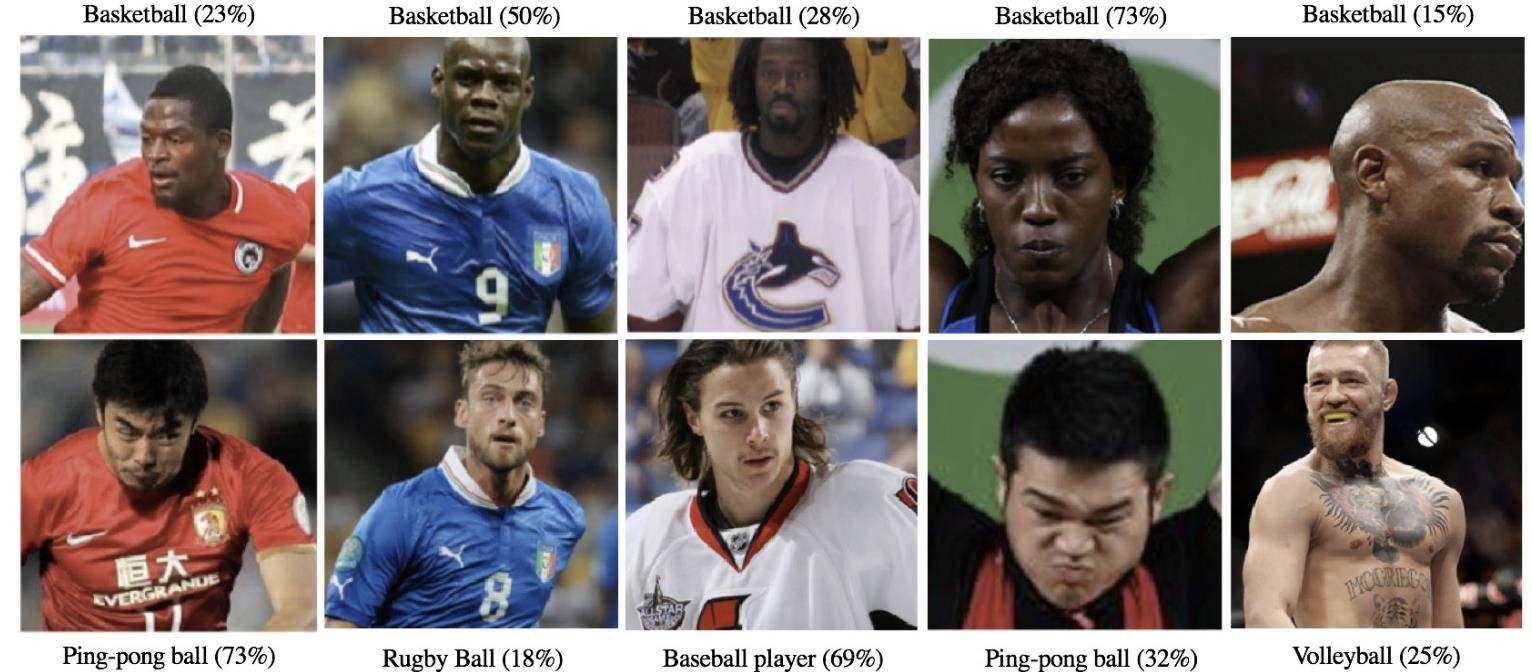
Pre-trained models carry bias to every task
An ImageNet model’s label depends on who is in the photo, not on what they are doing.
Labelled “basketball” Top row: Black people, most of them not playing basketball.A shortcut from the data Bottom row: similar photos of other people get labels like “ping-pong ball” or “rugby ball”.It spreads downstream Every model fine-tuned from it can inherit the shortcut.Stock, P., & Cisse, M. (2018). ConvNets and ImageNet beyond accuracy: Understanding mistakes and uncovering biases. In Computer Vision – ECCV 2018 (pp. 498–512). Springer. Shankar, S., Halpern, Y., Breck, E., Atwood, J., Wilson, J., & Sculley, D. (2017). No classification without representation: Assessing geodiversity issues in open data sets for the developing world [Preprint]. arXiv. https://arxiv.org/abs/1711.08536
Bias and fairness · types of harm Five kinds of harm
An ML system can be unfair in different ways.
Allocation. Unfairly gives out opportunities, resources or information, like loans or jobs. Quality of service. Works worse for some people. Representation. Over- or under-represents some groups, or ignores them. Stereotypes. Repeats and reinforces stereotypes. Denigration. Produces offensive or insulting outputs about a group. Mehrabi, N., Morstatter, F., Saxena, N., Lerman, K., & Galstyan, A. (2021). A survey on bias and fairness in machine learning. ACM Computing Surveys, 54 (6), 1–35. https://doi.org/10.1145/3457607
Fairness · who decides? What is fair depends on who you ask
There are more than 20 definitions of fairness, and many of them conflict.
Individuals care about their own case: would I get a different result if I were different? Policymakers and domain experts often look at average outcomes across the population. Lawyers and advocates focus on harm and equity, often through individual cases. The media often focuses on single cases, which are sometimes outliers. Mehrabi, N., Morstatter, F., Saxena, N., Lerman, K., & Galstyan, A. (2021). A survey on bias and fairness in machine learning. ACM Computing Surveys, 54 (6), 1–35. https://doi.org/10.1145/3457607
Fairness · three families Three families of fairness definitions
Each family asks a different question.
Group fairness. Do groups get similar statistics? For example, similar approval rates or error rates. Individual fairness. Do similar people get similar predictions, whatever their group? Causal fairness. Would the decision change if only the protected attribute changed? Dwork, C., Hardt, M., Pitassi, T., Reingold, O., & Zemel, R. (2012). Fairness through awareness. In Proceedings of the 3rd Innovations in Theoretical Computer Science Conference (pp. 214–226). ACM. https://doi.org/10.1145/2090236.2090255 Kusner, M. J., Loftus, J., Russell, C., & Silva, R. (2017). Counterfactual fairness. Advances in Neural Information Processing Systems, 30 . Hardt, M., Price, E., & Srebro, N. (2016). Equality of opportunity in supervised learning. Advances in Neural Information Processing Systems, 29 , 3315–3323.
Measuring fairness · a toy example
A toy loan example
A bank decides who gets a loan. 200 applicants, in two groups of 100.
Group A (100 people) approved denied would repay 72TP 8FN would default 4FP 16TN
80 of 100 would repay
Group B (100 people) approved denied would repay 30TP 20FN would default 15FP 35TN
50 of 100 would repay
\(\hat Y=1\): approved \(\qquad Y=1\): would repay \(\qquad S\in\{\mathrm{A},\mathrm{B}\}\): group
Metric 1 · demographic parity
Demographic parity
Do both groups get approved at the same rate?
Group A approved denied repay 72 8 default 4 16
Group B approved denied repay 30 20 default 15 35
Approval rate Approved people ÷ all people in the group
Group A (72 + 4) / 100 0.76
Group B (30 + 15) / 100 0.45
Not equal → fails
\(P(\hat Y=1\mid S=\mathrm{A})\;=\;P(\hat Y=1\mid S=\mathrm{B})\)
Example: if 50% of men see a job ad, 50% of women should see it too.
Metrics 2 and 3 · error rates
Equal opportunity and equalized odds
Measure two error rates, then ask: are they equal across groups?
Group A approved denied repay → TPR 72 8 default → FPR 4 16
Group B approved denied repay → TPR 30 20 default → FPR 15 35
TPR \(=P(\hat Y=1\mid Y=1,S)\) Of repayers (blue row), how many got the loan?
Group A 72 / 80 0.90
Group B 30 / 50 0.60
FPR \(=P(\hat Y=1\mid Y=0,S)\) Of defaulters (red row), how many got the loan?
Group A 4 / 20 0.20
Group B 15 / 50 0.30
Equal opportunity = equal TPR. 0.90 ≠ 0.60 → fails
Equalized odds = equal TPR and equal FPR. 0.20 ≠ 0.30 too → fails
Use these when mistakes hurt people, e.g. wrongly flagging innocent people in COMPAS.
Hardt, M., Price, E., & Srebro, N. (2016). Equality of opportunity in supervised learning. Advances in Neural Information Processing Systems, 29 , 3315–3323.
Metric 4 · predictive parity
Predictive parity
Does an approval mean the same thing in both groups?
Group A approved denied repay 72 8 default 4 16
Group B approved denied repay 30 20 default 15 35
Positive predictive value (PPV) Of people we approved , how many repay?
Group A 72 / 76 0.95
Group B 30 / 45 0.67
Not equal → fails
\(P(Y=1\mid\hat Y=1,S=\mathrm{A})\;=\;P(Y=1\mid\hat Y=1,S=\mathrm{B})\)
Example: a loan approval should mean the same chance of repaying in group A and group B.
Metrics · limits What fairness metrics cannot do
Useful, but they never tell the whole story.
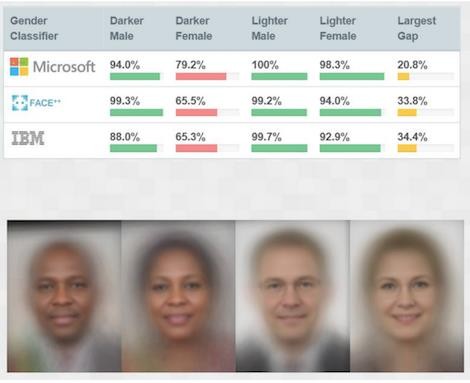
They conflict. When groups differ (80% vs 50% repay), no model meets all three metrics. We must choose one. Small groups are noisy. With 8 people, one mistake changes a rate by 12.5%. Report the group size n. The data may be wrong. Missing data, poor proxies and noisy labels change the result. One number hides the cause. It shows a gap, not its cause, e.g. bigger loan requests. Kleinberg, J., Mullainathan, S., & Raghavan, M. (2017). Inherent trade-offs in the fair determination of risk scores. In 8th Innovations in Theoretical Computer Science Conference (ITCS 2017) (pp. 43:1–43:23). Schloss Dagstuhl. https://doi.org/10.4230/LIPIcs.ITCS.2017.43 Chouldechova, A. (2017). Fair prediction with disparate impact: A study of bias in recidivism prediction instruments. Big Data, 5 (2), 153–163. https://doi.org/10.1089/big.2016.0047 Buolamwini, J., & Gebru, T. (2018). Gender Shades: Intersectional accuracy disparities in commercial gender classification. In Proceedings of the 1st Conference on Fairness, Accountability and Transparency (pp. 77–91). PMLR. Fairness · error costs Not all errors cost the same
Which error is worse depends on the application.
Loans. A false positive approves someone who defaults: the bank loses money. A false negative denies someone who would repay: they lose an opportunity. Criminal justice. A false positive labels a person high risk when they would not reoffend. This is usually the worse error. Decide with the people affected. Choose the metric and the threshold together, following legal and ethical guidelines.
Fairness · choosing a metric
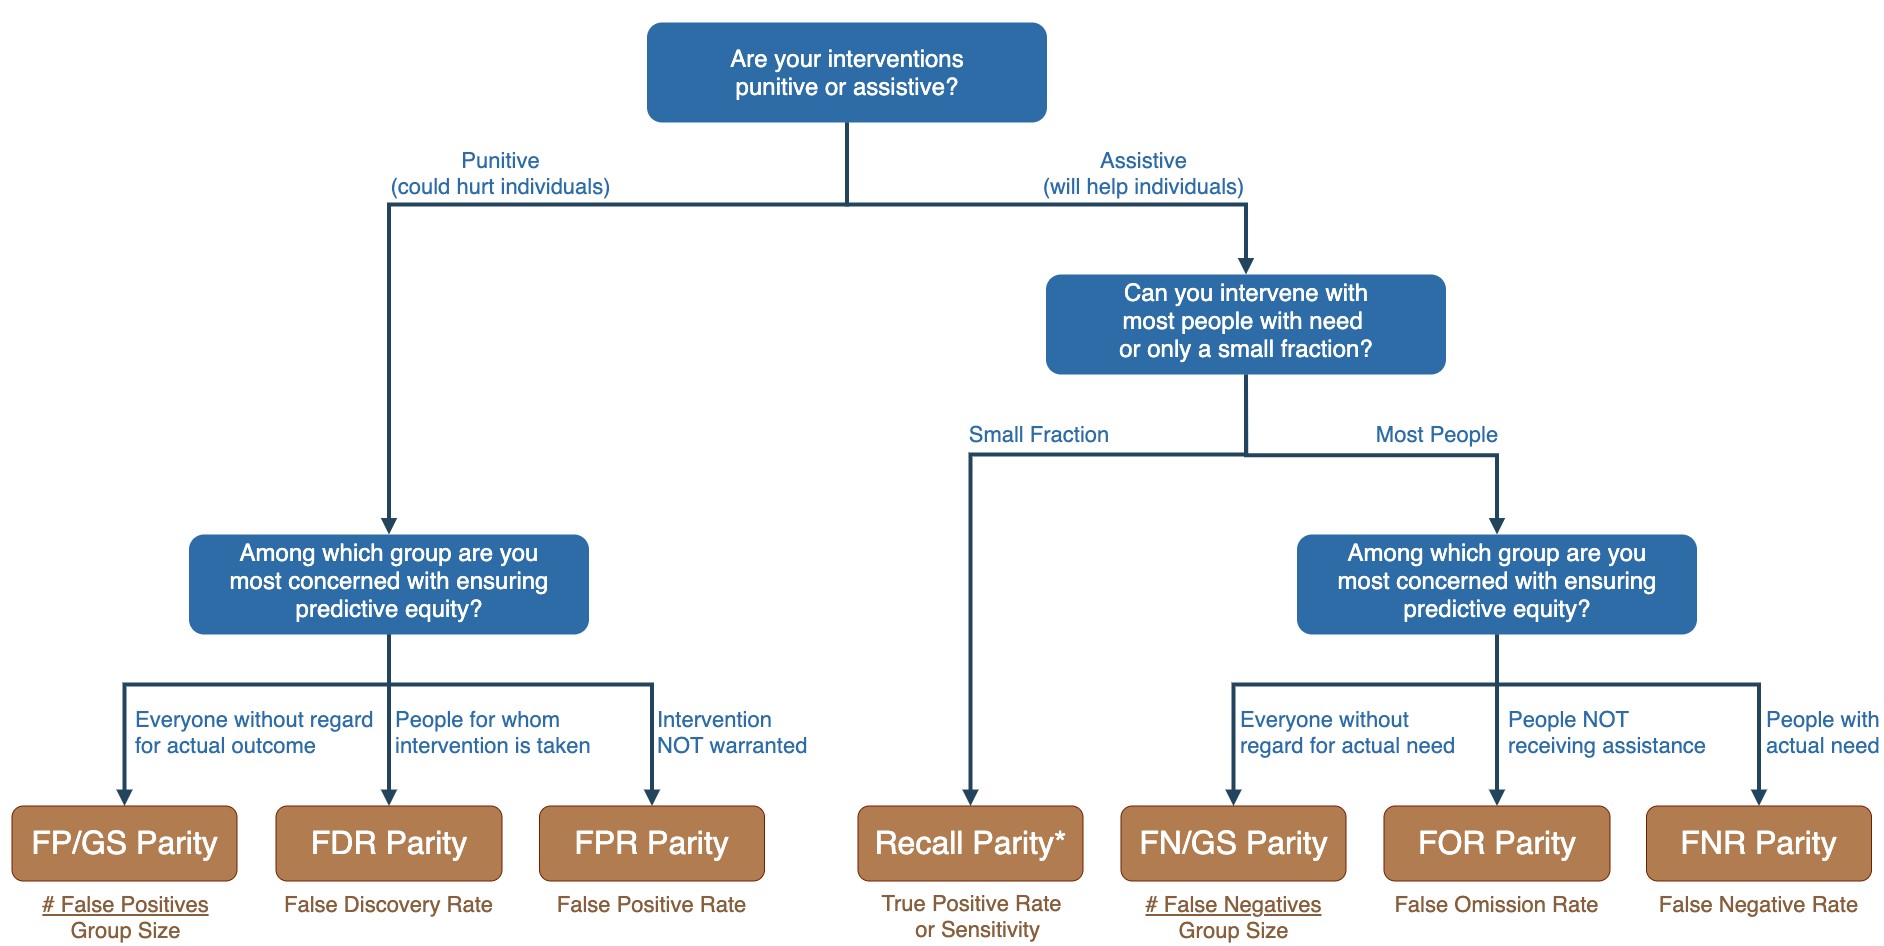
A decision tree for choosing a metric
Answer a few questions about your application, and the tree suggests a metric.
Punitive or assistive? Does the decision hurt people (jail) or help them (a benefit)?Who are you most worried about? Everyone in a group, or only the people who need help?The leaf gives the metric For example: false positive rate parity, or false negative rate parity.Saleiro, P., Kuester, B., Hinkson, L., London, J., Stevens, A., Anisfeld, A., Rodolfa, K. T., & Ghani, R. (2018). Aequitas: A bias and fairness audit toolkit [Preprint]. arXiv. https://arxiv.org/abs/1811.05577
Sources of bias · the pipeline Bias can enter at every stage
It is not only the training data.
Training data. Historical bias (the world is already biased), representation bias (who is sampled), measurement bias (how features are measured). The model. Algorithmic bias (added by the learning method), evaluation bias (an unrepresentative test set). Deployment. Human bias (people override or misuse predictions), emergent bias (the users or the world change). Mehrabi, N., Morstatter, F., Saxena, N., Lerman, K., & Galstyan, A. (2021). A survey on bias and fairness in machine learning. ACM Computing Surveys, 54 (6), 1–35. https://doi.org/10.1145/3457607
Sources of bias · representation
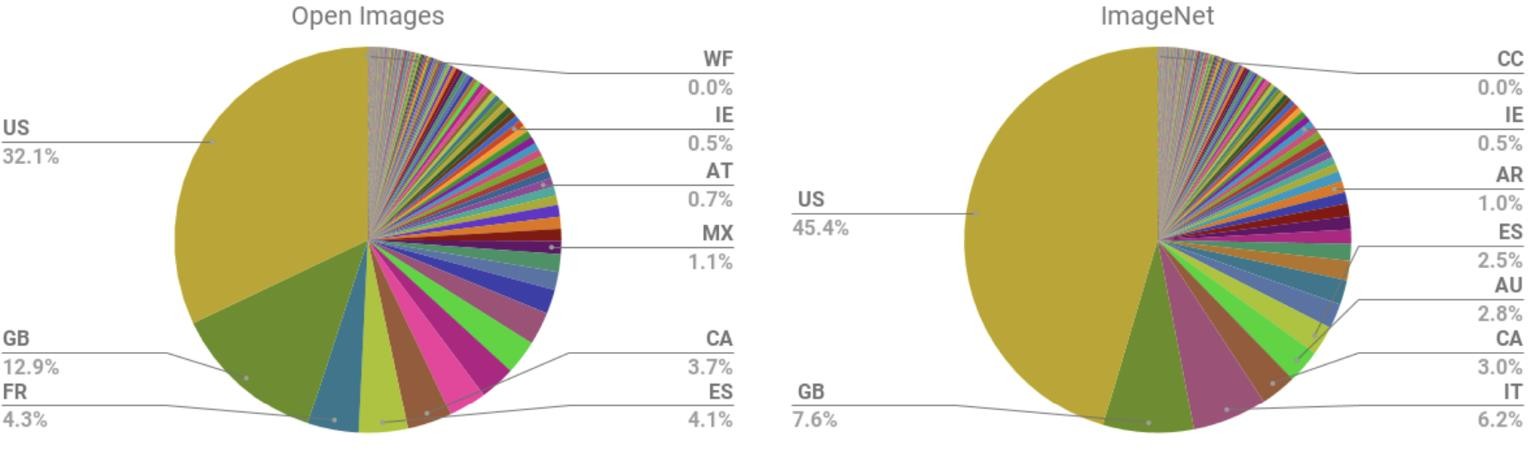
Most training images come from a few countries
Open Images and ImageNet are dominated by images from the US and Europe.
Open Images About 32% of images come from the US.ImageNet About 45% come from the US.Most of the world is missing Countries like India and China, with large populations, have very few images.Shankar, S., Halpern, Y., Breck, E., Atwood, J., Wilson, J., & Sculley, D. (2017). No classification without representation: Assessing geodiversity issues in open data sets for the developing world [Preprint]. arXiv. https://arxiv.org/abs/1711.08536
Sources of bias · evaluation
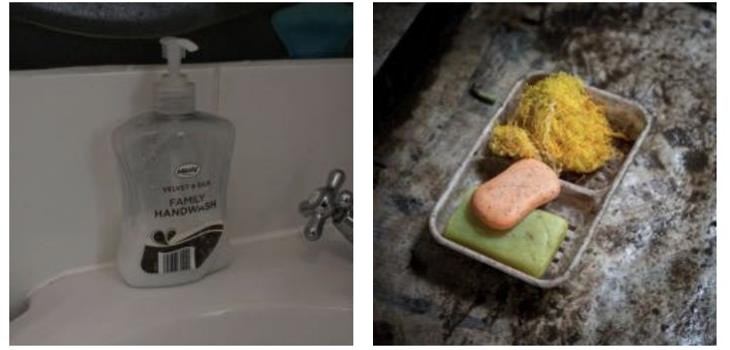
Same object, wrong labels
Image APIs work worse on everyday objects from other cultures and countries.
Two photos of soap Left: a home in the UK. Right: a home in Nepal.Same APIs, different results UK photo: mostly right. Nepal photo: “food, cheese, bread, cake”.Test on real users Test with photos from many countries and cultures, not only ones like the training data.DeVries, T., Misra, I., Wang, C., & van der Maaten, L. (2019). Does object recognition work for everyone? [Preprint]. arXiv. https://arxiv.org/abs/1906.02659
Mitigation · where to intervene
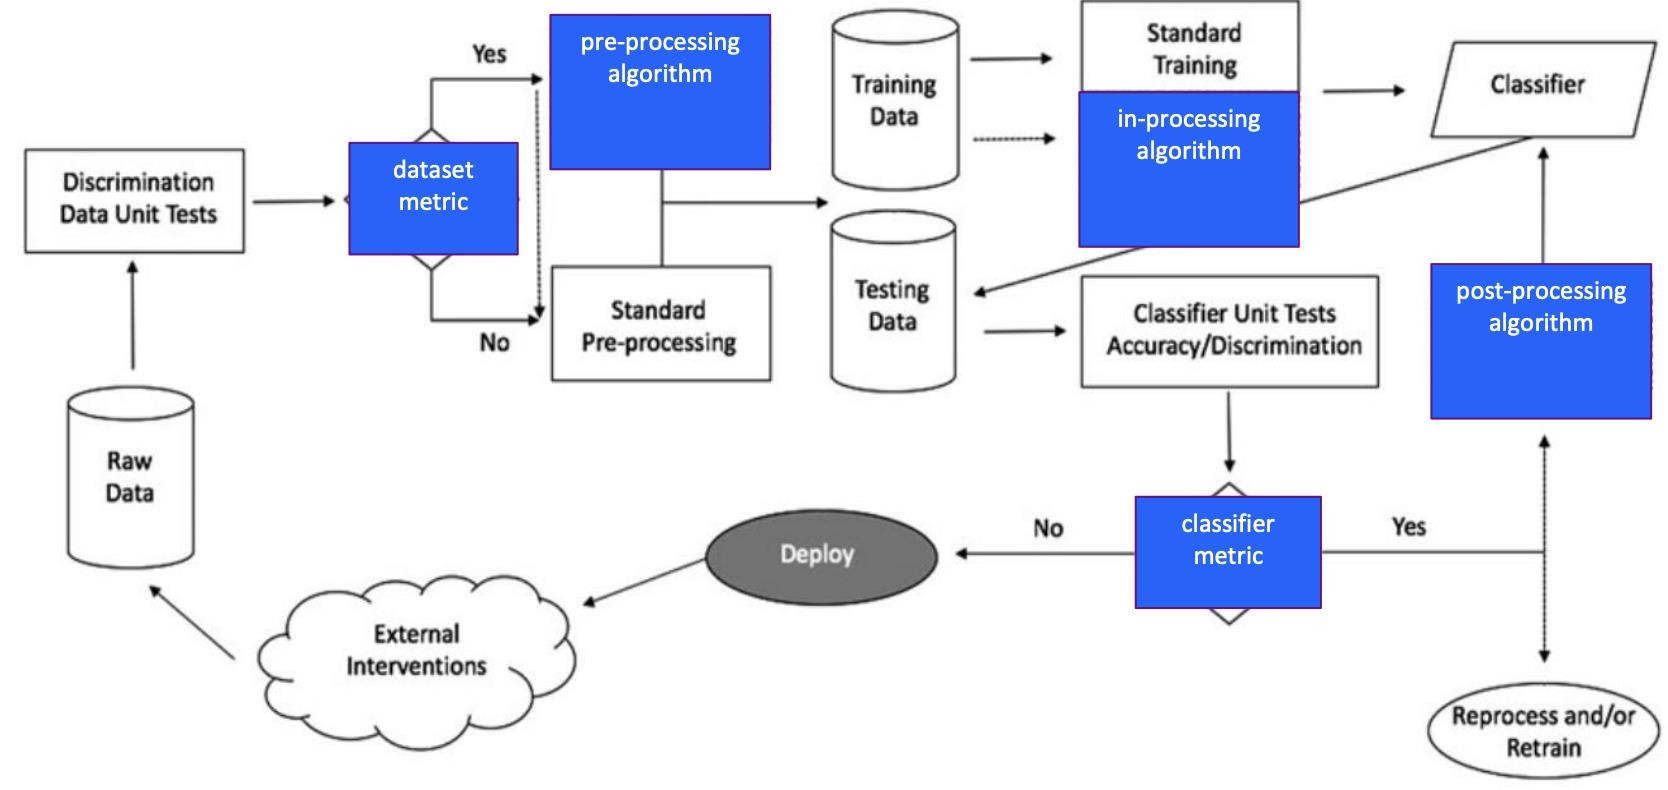
Three places to reduce bias
Before, during or after training.
Pre-processing Change the training data. Use it if you can edit the data.In-processing Change how the model is trained. Use it if you can change the training.Post-processing Change the predictions. Use it if the model is a black box.Bellamy, R. K. E., Dey, K., Hind, M., Hoffman, S. C., Houde, S., Kannan, K., Lohia, P., Martino, J., Mehta, S., Mojsilović, A., Nagar, S., Natesan Ramamurthy, K., Richards, J., Saha, D., Sattigeri, P., Singh, M., Varshney, K. R., & Zhang, Y. (2019). AI Fairness 360: An extensible toolkit for detecting and mitigating algorithmic bias. IBM Journal of Research and Development, 63 (4/5), 4:1–4:15. https://doi.org/10.1147/JRD.2019.2942287
Mitigation · methods Example methods for each stage
A few well-known methods. We look at some of them next.
Pre-processing (data). Reweighting (rare group–label rows count more), disparate impact remover, fair data augmentation. In-processing (training). Fairness regularisers, adversarial debiasing, fair representations, DBVAE. Post-processing (predictions). Group-specific thresholds, equalized-odds post-processing, reject option. Mehrabi, N., Morstatter, F., Saxena, N., Lerman, K., & Galstyan, A. (2021). A survey on bias and fairness in machine learning. ACM Computing Surveys, 54 (6), 1–35. https://doi.org/10.1145/3457607 Hardt, M., Price, E., & Srebro, N. (2016). Equality of opportunity in supervised learning. Advances in Neural Information Processing Systems, 29 , 3315–3323. Kamiran, F., & Calders, T. (2012). Data preprocessing techniques for classification without discrimination. Knowledge and Information Systems, 33 (1), 1–33. https://doi.org/10.1007/s10115-011-0463-8
In-processing · adversarial debiasing
Adversarial debiasing
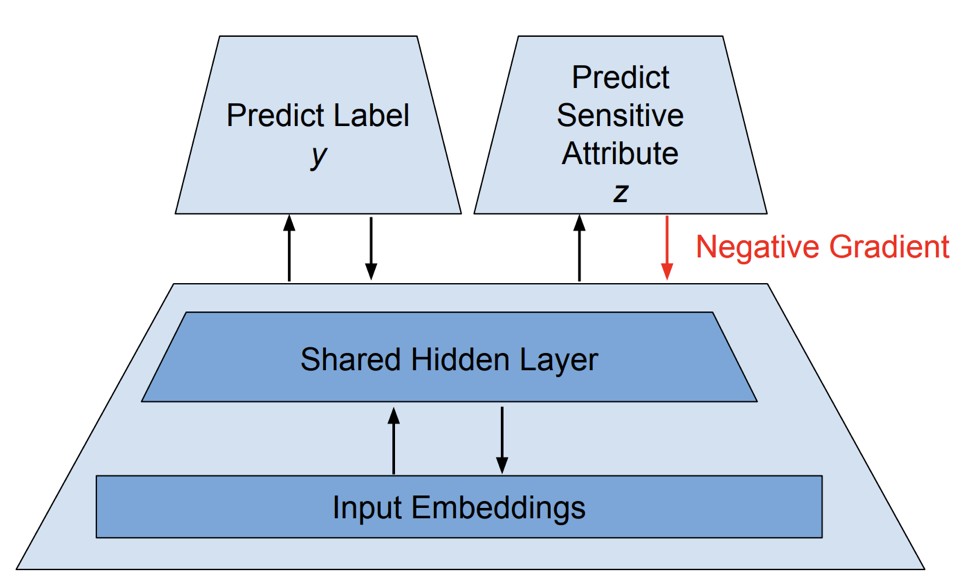
Predict the label well, but make it impossible to predict the protected attribute.
Two heads One head predicts the label \(Y\); the other predicts the protected attribute \(Z\).Reverse the gradient On the backward pass, the gradient from the \(Z\) head is flipped before it reaches the shared layers.Result The features help predict \(Y\), but carry little information about \(Z\).\(\displaystyle \min\ \sum_{(x,y)}\mathcal L_Y\big(f(g(x)),y\big)\ +\ \sum_{(x,z)}\mathcal L_Z\big(h(J_\lambda(g(x))),z\big)\qquad J_\lambda:\text{ identity forward, }-\lambda\cdot\text{gradient backward}\)
\(x\): input · \(y\): label · \(z\): protected attribute (e.g. gender) · \(g\): shared layers · \(f\): label head · \(h\): adversary head · \(\mathcal L_Y,\mathcal L_Z\): losses
Zhang, B. H., Lemoine, B., & Mitchell, M. (2018). Mitigating unwanted biases with adversarial learning. In Proceedings of the 2018 AAAI/ACM Conference on AI, Ethics, and Society (pp. 335–340). ACM. https://doi.org/10.1145/3278721.3278779 Beutel, A., Chen, J., Zhao, Z., & Chi, E. H. (2017). Data decisions and theoretical implications when adversarially learning fair representations [Preprint]. arXiv. https://arxiv.org/abs/1707.00075
In-processing · adversarial debiasing
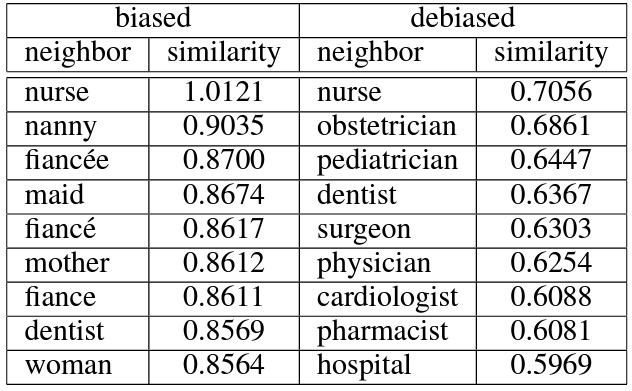
Example: word analogies
“He is to she as doctor is to ?” The table lists the closest words, before and after debiasing.
How to read it Neighbor: a word close to doctor − he + she. Similarity: how close (higher = closer).Before (biased) Top answers: nurse, nanny, fiancée, maid.After debiasing Top answers: nurse, obstetrician, pediatrician, dentist, surgeon.Zhang, B. H., Lemoine, B., & Mitchell, M. (2018). Mitigating unwanted biases with adversarial learning. In Proceedings of the 2018 AAAI/ACM Conference on AI, Ethics, and Society (pp. 335–340). ACM. https://doi.org/10.1145/3278721.3278779
In-processing · limitations
Limits of adversarial debiasing
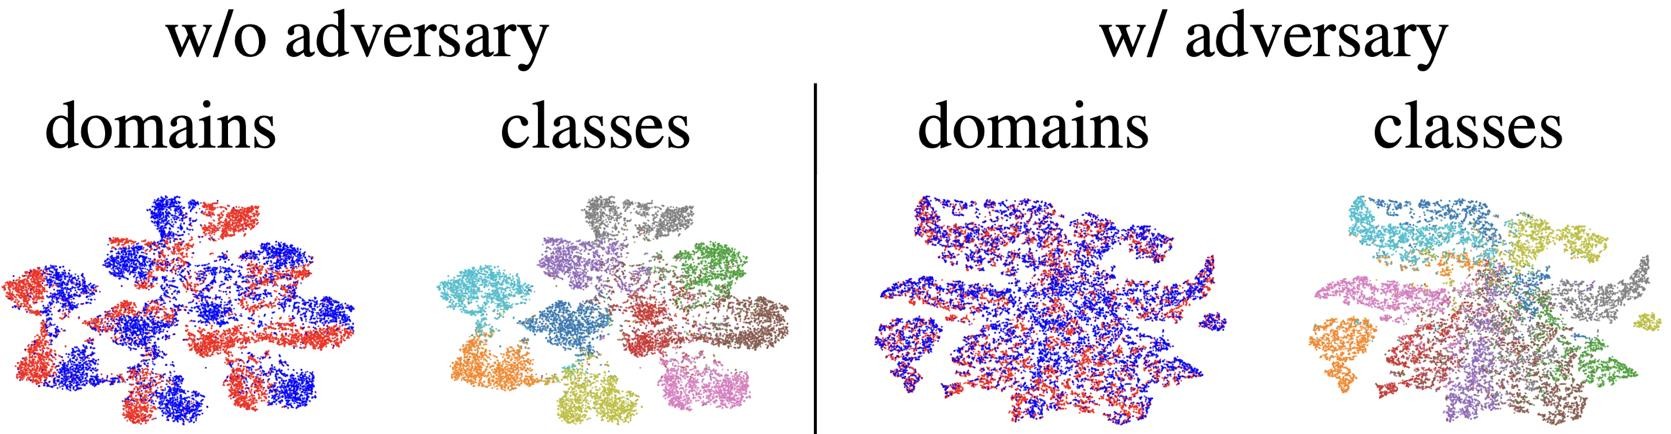
Removing the protected attribute can also hurt the main task.
Accuracy can drop With the adversary, the classes also get mixed (right).You must name the attribute Unnamed attributes and proxies can remain.Re-check the metrics Hiding \(Z\) does not guarantee equal error rates.Wang, Z., Qinami, K., Karakozis, I. C., Genova, K., Nair, P., Hata, K., & Russakovsky, O. (2020). Towards fairness in visual recognition: Effective strategies for bias mitigation. In 2020 IEEE/CVF Conference on Computer Vision and Pattern Recognition (CVPR) (pp. 8919–8928). IEEE.
In-processing · DBVAE
DBVAE: find and up-sample rare faces
Learn which faces are rare in the training data, and show them more often.
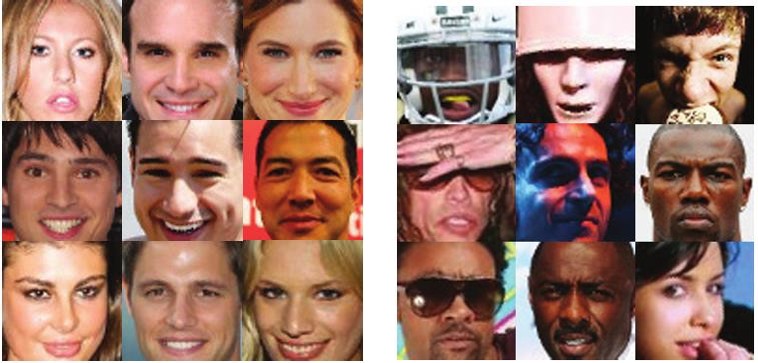
A normal batch (left) Mostly similar faces: light skin, frontal, no occlusion.A DBVAE batch (right) More diverse: skin colour, lighting, hats and occlusions.No labels needed The model finds the rare features by itself.Amini, A., Soleimany, A. P., Schwarting, W., Bhatia, S. N., & Rus, D. (2019). Uncovering and mitigating algorithmic bias through learned latent structure. In Proceedings of the 2019 AAAI/ACM Conference on AI, Ethics, and Society (pp. 289–295). ACM. https://doi.org/10.1145/3306618.3314243
In-processing · DBVAE
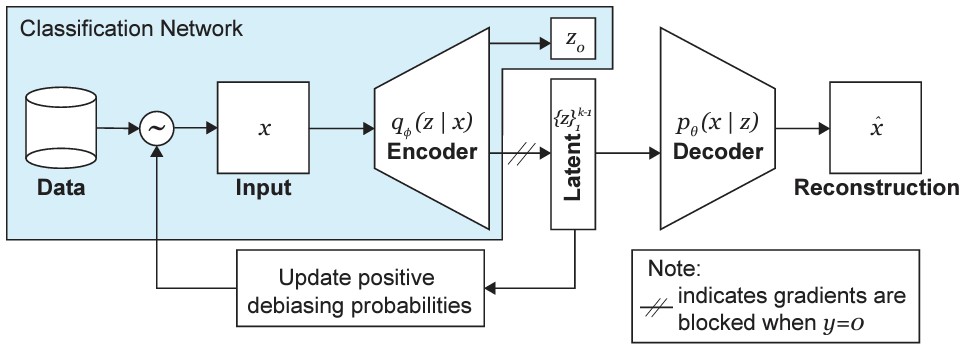
How DBVAE resamples
Rare latent codes get a higher chance of being picked for training.
Encode each face A VAE encoder maps each face to a latent code \(z\).Estimate how common it is A histogram \(\hat Q\) of the codes shows which faces are rare.Sample rare faces more Weight \(W\) is large when \(\hat Q\) is small.\(\displaystyle W(z(x)\mid X)\ \propto\ \prod_i\frac{1}{\hat Q_i(z_i\mid X)+\alpha}\)
\(x\): a face · \(X\): all training faces · \(z(x)\): its latent code · \(z_i\): the \(i\)-th latent variable · \(\hat Q_i\): histogram of \(z_i\) · \(\alpha\): debiasing strength · \(W\): sampling weight
Amini, A., Soleimany, A. P., Schwarting, W., Bhatia, S. N., & Rus, D. (2019). Uncovering and mitigating algorithmic bias through learned latent structure. In Proceedings of the 2019 AAAI/ACM Conference on AI, Ethics, and Society (pp. 289–295). ACM. https://doi.org/10.1145/3306618.3314243
In-processing · DBVAE
Which faces does DBVAE up-sample?
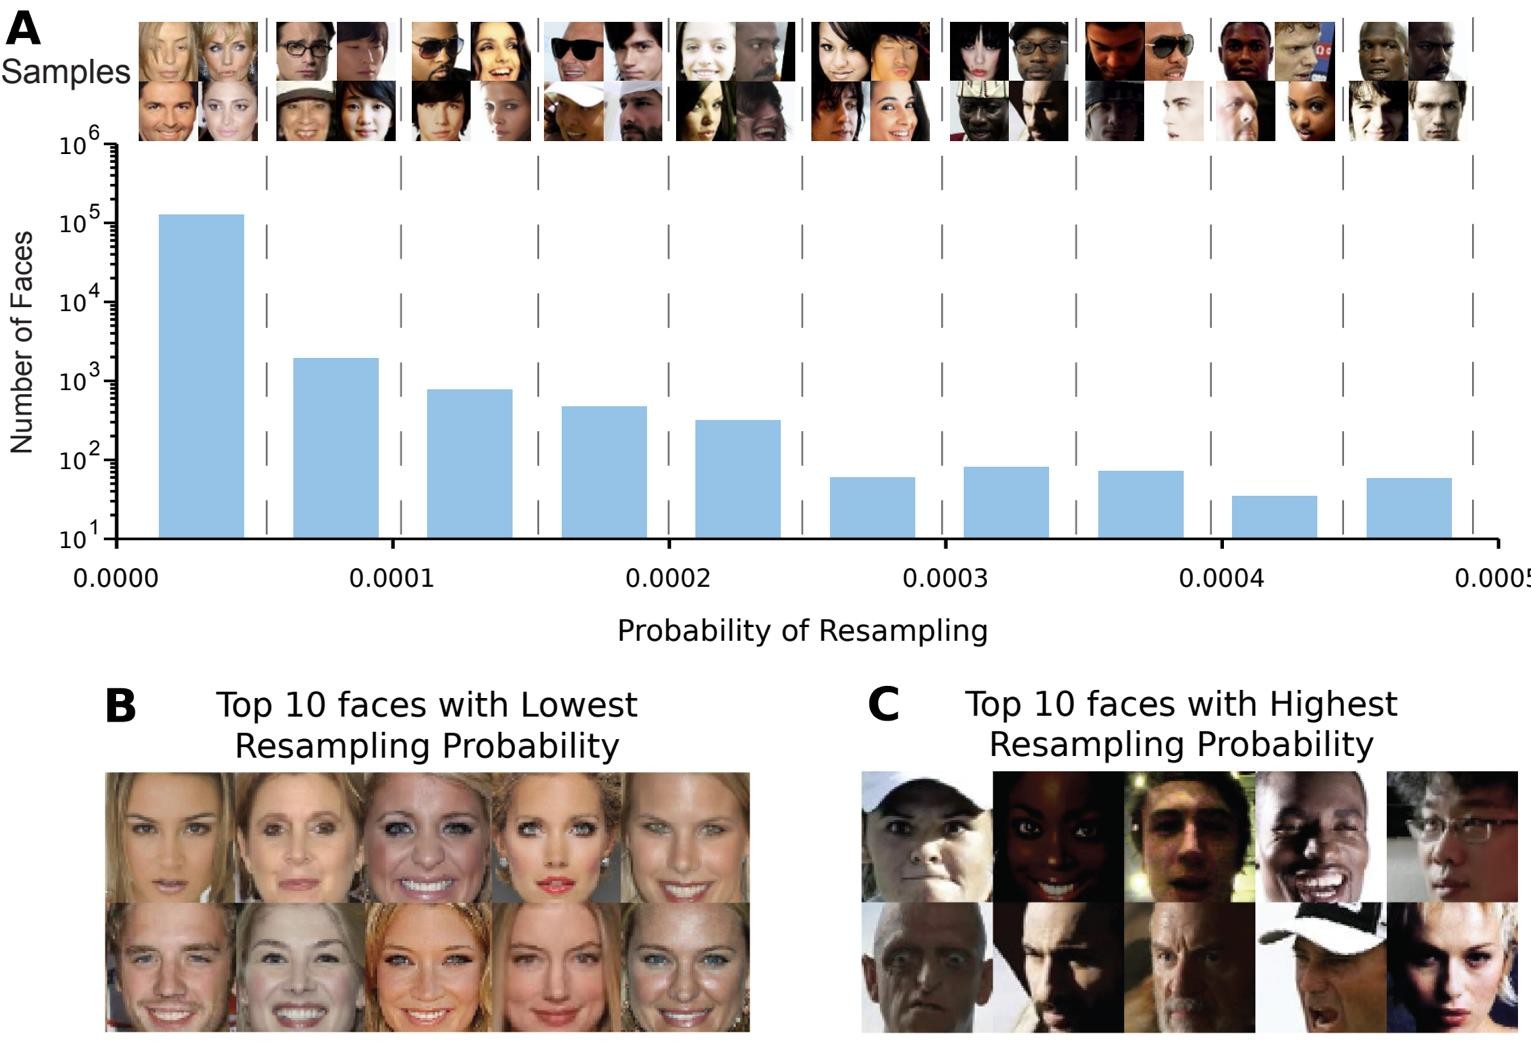
Result on CelebA: most faces have a tiny resampling probability; a few rare ones get much more.
Most faces: low probability The histogram: most faces have a very small chance of being picked.Lowest probability (B) Similar faces: lighter skin, frontal, no hats.Highest probability (C) Darker skin, hats, unusual poses and lighting.Amini, A., Soleimany, A. P., Schwarting, W., Bhatia, S. N., & Rus, D. (2019). Uncovering and mitigating algorithmic bias through learned latent structure. In Proceedings of the 2019 AAAI/ACM Conference on AI, Ethics, and Society (pp. 289–295). ACM. https://doi.org/10.1145/3306618.3314243
Summary Bias and fairness: summary
Unfair ML causes real harm. COMPAS, Gender Shades, recommenders and pre-trained models. Fairness metrics can conflict. Choose one with the people affected. Bias enters at every stage. Training data, the model, and deployment. Reduce it early, and keep checking. Fix it in the data if you can, and audit again after deployment. Toolkits help you measure. AI Fairness 360, Fairlearn, Aequitas, What-If Tool. They do not decide what is fair. Next lecture Guest lecture: Dr Jun Wang (Amazon)